Aim

I am a Node on the Edge because I cannot claim to have all the answers or a decade long history of experience but I can help to define questions to be solved. Hopefully their is a potential finite set of questions that allow most requirements be solved and my aim is define these with collaboration of the community.
It would be amazing if these questions developed into some kind of NP Complete space where they all referred to one question such in NP Complete Theory or Monty Pythons Holy Grail but that is/maybe asking too much?

Thursday, 28 January 2016

Node on Effective Graph Layout: Key Factors

KEY FACTORS 
in Node and Edge Graph Layouts

AIM:

        "Getting the message across in the simplest layout without confusing the user."

                  Most Intuitive Layout Vs Most Semantic Meaning -> a Ink : Data ratio
                                   
                                                         
METRIC: Ink : Data ratio  ->  Amount of Ink used  : to : Amount of Data Visualised


VARIABLES: Node Type,
                         Edge Type,
                         Node Grouping
                         Node/Edge Position
  These are 4 main variable in a graph which can be changed to improve this ink : data ratio

KF: Complexity - Sometime the nodes are so connected that it seem every node is connected with one edge to every other node. This sometimes masks those nodes which are less connected i.e have less edge attached. This complexity of connections makes the graph layout look messy and it becomes difficult to interpret.
SOLUTION: Use groups so that every node in that group is connected by an edge to every node in another group. Then it easy to see that the less connected node are those with less edges attached.
EXAMPLE: The 1st Graph look's like all node are connected to every other node but the 2nd Graph shows 3 is not connected to 5 or 1 so not well connected in fact not all nodes are connected to every other node.
VARIABLES: Reduce Amount of Edges and Add more Groups
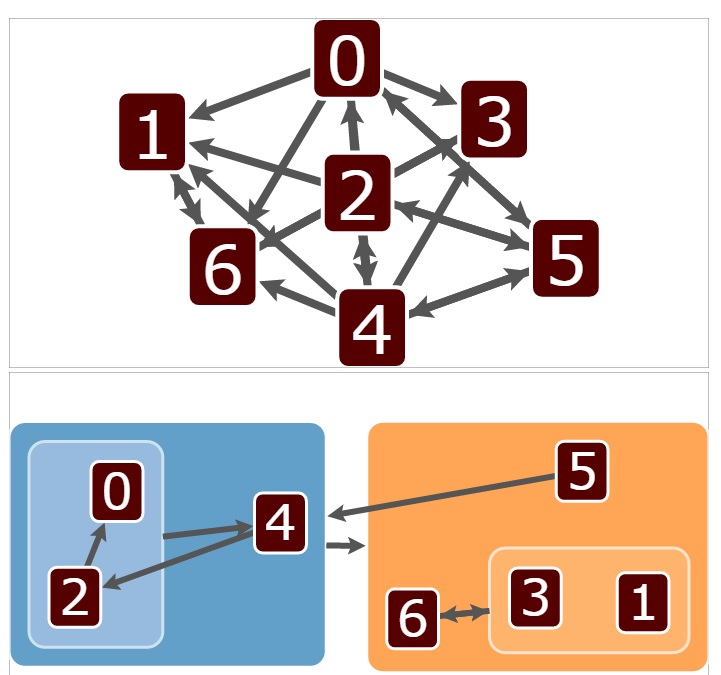
Reduce Complexity by Grouping Node on their Edge Connections

TECHNICAL SOLUTION: cola.js using d3.js  Simple (0) -- Difficult(5) : to USE 0 to DEVELOP 4     see example


Sunday, 10 January 2016

Node finding the Edge of History: Long History of Big Data

Long History of Big Data 

Big Data is a buzzword to define the Explosion of Data available from Start to now

Here is what catalysized it, proceed it, progress its made and the main events.  

Catalyst

More  sensors  More  data stored  More analysis  More access


1 Information Overload

The explosion of information available

Defined in Future Shock by Alvin Toffler in 1970 
This is both information and data without any explanation of its larger context. The larger context is where the most meaning is. Without processing the information and data this meaning cannot be seen Problem: Not seeing this meaning because of too much information or information overload is a Catalyst.
Solution: It is a Catalyst to finding how to process it to summarise the meaning so can understand more information quicker.      
Causes:
  • A rapid increase in the production rate of new information
  • The ease of duplication and transmission of data across the Internet
  • An increase in the available channels of incoming information (e.g. telephone, e-mail, instant messaging, rss)
  • Large amounts of historical information
  • Contradictions and inaccuracies in available information
  • A low signal-to-noise ratio (informally, the ratio of useful information to false or irrelevant data)
  • lack of a method for comparing and processing different kinds of information

Key Timelines:

1 The information overload from US Census in 1880 took 8 year to complete 
   A key realisation for governments of the task of population management.   

2 The information overload 


References

1 http://www.newworldencyclopedia.org/entry/Information_explosion

Saturday, 9 January 2016

Node on the Edge of a bookshelf: Reinventing Discovery M Nielsen

Node on a Bookshelf

Book Review:

Reinventing Discovery The New Era of Networked Science by Michael Nielsen

Reviewed: 01/2016

Reinventing Discovery

Part 1 Amplifying Collective Intelligence

Online Tools Make Us Smarter

Restructuring Expert Attention

Patterns of Online Collaboration

The Limits and the Potential of Collective Intelligence

Part 2 Networked Science

All the World's Knowledge

Democratizing Science

The Challenge of Doing Science in the Open

The Open Science Imperative

Selected Sources and Suggestions for Further Reading

References


Friday, 11 September 2015

Node Depicting and Pushing Buzzwords to the Edge: Buzzwords


The biggest of them all of course   BIG DATA

DEFINITION  : Has of three V's Volume Velocity Variety

                          Large amount of Data either structured or unstructured from a specific source.


Data Analytics


Behavioural Analytics


Predictive Analytics


Prescriptive Analytics


Wednesday, 2 September 2015

Node starting from the first Edge: Short History of Big Data from the start


              Catalysts                                                                                

information Overload                                                              tabulating Machine

 "The end of the quilt pen"                                                      "Automation of documentation"
                                                                                                 
e.g. The 1880 US Census took 8 year                                      Hollerith Tabulating Machine 1881 
to tabulate and it was estimated 1890                                      used to tabulate the census in one        
would take more than 10 years                                                year      
In 1970 A Toffler defines causes see more


documenting for knowledge research                                     expansion of libraries

  " When records began"                                                         "Accessible records"

e.g. The 1932 US population boom                                                      
and more documentation Social Security ID etc

expansion and requirement for communication                     The setting up of Networks

 " Instant communication "                                                    " Connected Devices"

e.g The invention of the telephone from the                        e.g. Radio's, LAN's, Mobile Telephones
1st patent by A G Bell to mass use from                                     and world wide web with IP
1930's to near universal usage from 1960's

defining of Information Theory                                          

 " Clear Signals "

e.g. Shannon and Weaver published in 1949
The Mathematical Theory of Communication
to define how to send and define information
to be measured or manipulated


Business Intelligence                                                                                        


                                                                       BIG DATA


Determined:


3D Data Management Controlling Data Volume Velocity Variety Doug Laney 2001


What is it? 

Volume - How much

Velocity - How produced at what speed

Variety - How much variety in attributes


Image result for covered in big data  Image result for covered in big dataImage result for elephant covered in big data


Data Source

Sensors on processes      Sensors on interactions of Processes        Sensors on interaction of Objects
                                                                                                               and processess


Data Storage

Technologies


Apache Hadoop


Data Processing

MapReduce